


Docker
View the Docker Wiki for more information and advanced usage.
docker run -it -p 8080:8080 statping/statping
MacOSX
View the Mac Wiki for more information and other methods.
brew tap statping/statping
brew install statping
Linux
View the Linux Wiki for more information and other methods.
curl -o- -L https://statping.com/install.sh | bash

snap install statping
Windows
Download the latest version as an .exe from Releases. View the Windows Wiki for more information and other methods.
EC2
// exploring new methods for the AMI image.
Development
Features
3 Different Databases
You can use MySQL, Postgres, or SQLite as a database for your Statping status page. The server will automatically upgrade your database tables depending on which database you have.
Easy to Startup
Statping is an extremely easy to setup website monitoring tool without fussing with dependencies or packages. Simply download and install the precompile binary for your operating system. Statping works on Windows, Mac, Linux, Docker, and even the Raspberry Pi.
Plugins
Statping is an awesome Status Page generator that allows you to create your own plugins with Golang Plugins! You don’t need to request a PR or even tell us about your plugin. Plugin’s are compiled and then send as a binary to the Statping /plugins folder. Test your plugins using the statup test plugin command, checkout the Plugin Wiki to see detailed information about creating plugins.
No Maintenance
Many other website monitoring applications will collect data until the server fails because of hard drive is 100% full. Statping will automatically delete records to make sure your server will stay UP for years. The EC2 AMI Image is a great way to host your status page without worrying about it crashing one day. Statping will automatically upgrade its software when you reboot your computer.
Email & Slack Notifications
Receive email notifications if your website or application goes offline. Statping includes SMTP connections so you can use AWS SES, or any other SMTP emailing service. Go in the Email Settings in Settings to configure these options.
Prometheus Exporter
If you want a deeper view of your applications status, you can use Grafana and Prometheus to graph all types of data about your services. Read more about the Prometheus Exporter
Paid Hosting
Statping.com now provides a service that will host your Statping instance for you! For $6.00/month you won’t need to worry about maintaining your own Statping instance. Billing platform is using Stripe and you can cancel at anytime.

Help support the project by donating or have us host your Statping instance.
Types of Monitoring
You can monitor your application by using a simple HTTP GET to the endpoint to return back a response and status code. Normally you want a 200 status code on an HTTP request. You might want to require a 404 or 500 error as a response code though. With each service you can include a Timeout in seconds to work with your long running services.
HTTP Endpoints with Custom POST
For more advanced monitoring you can add a data as a HTTP POST request. This is useful for automatically submitting JSON, or making sure your signup form is working correctly.
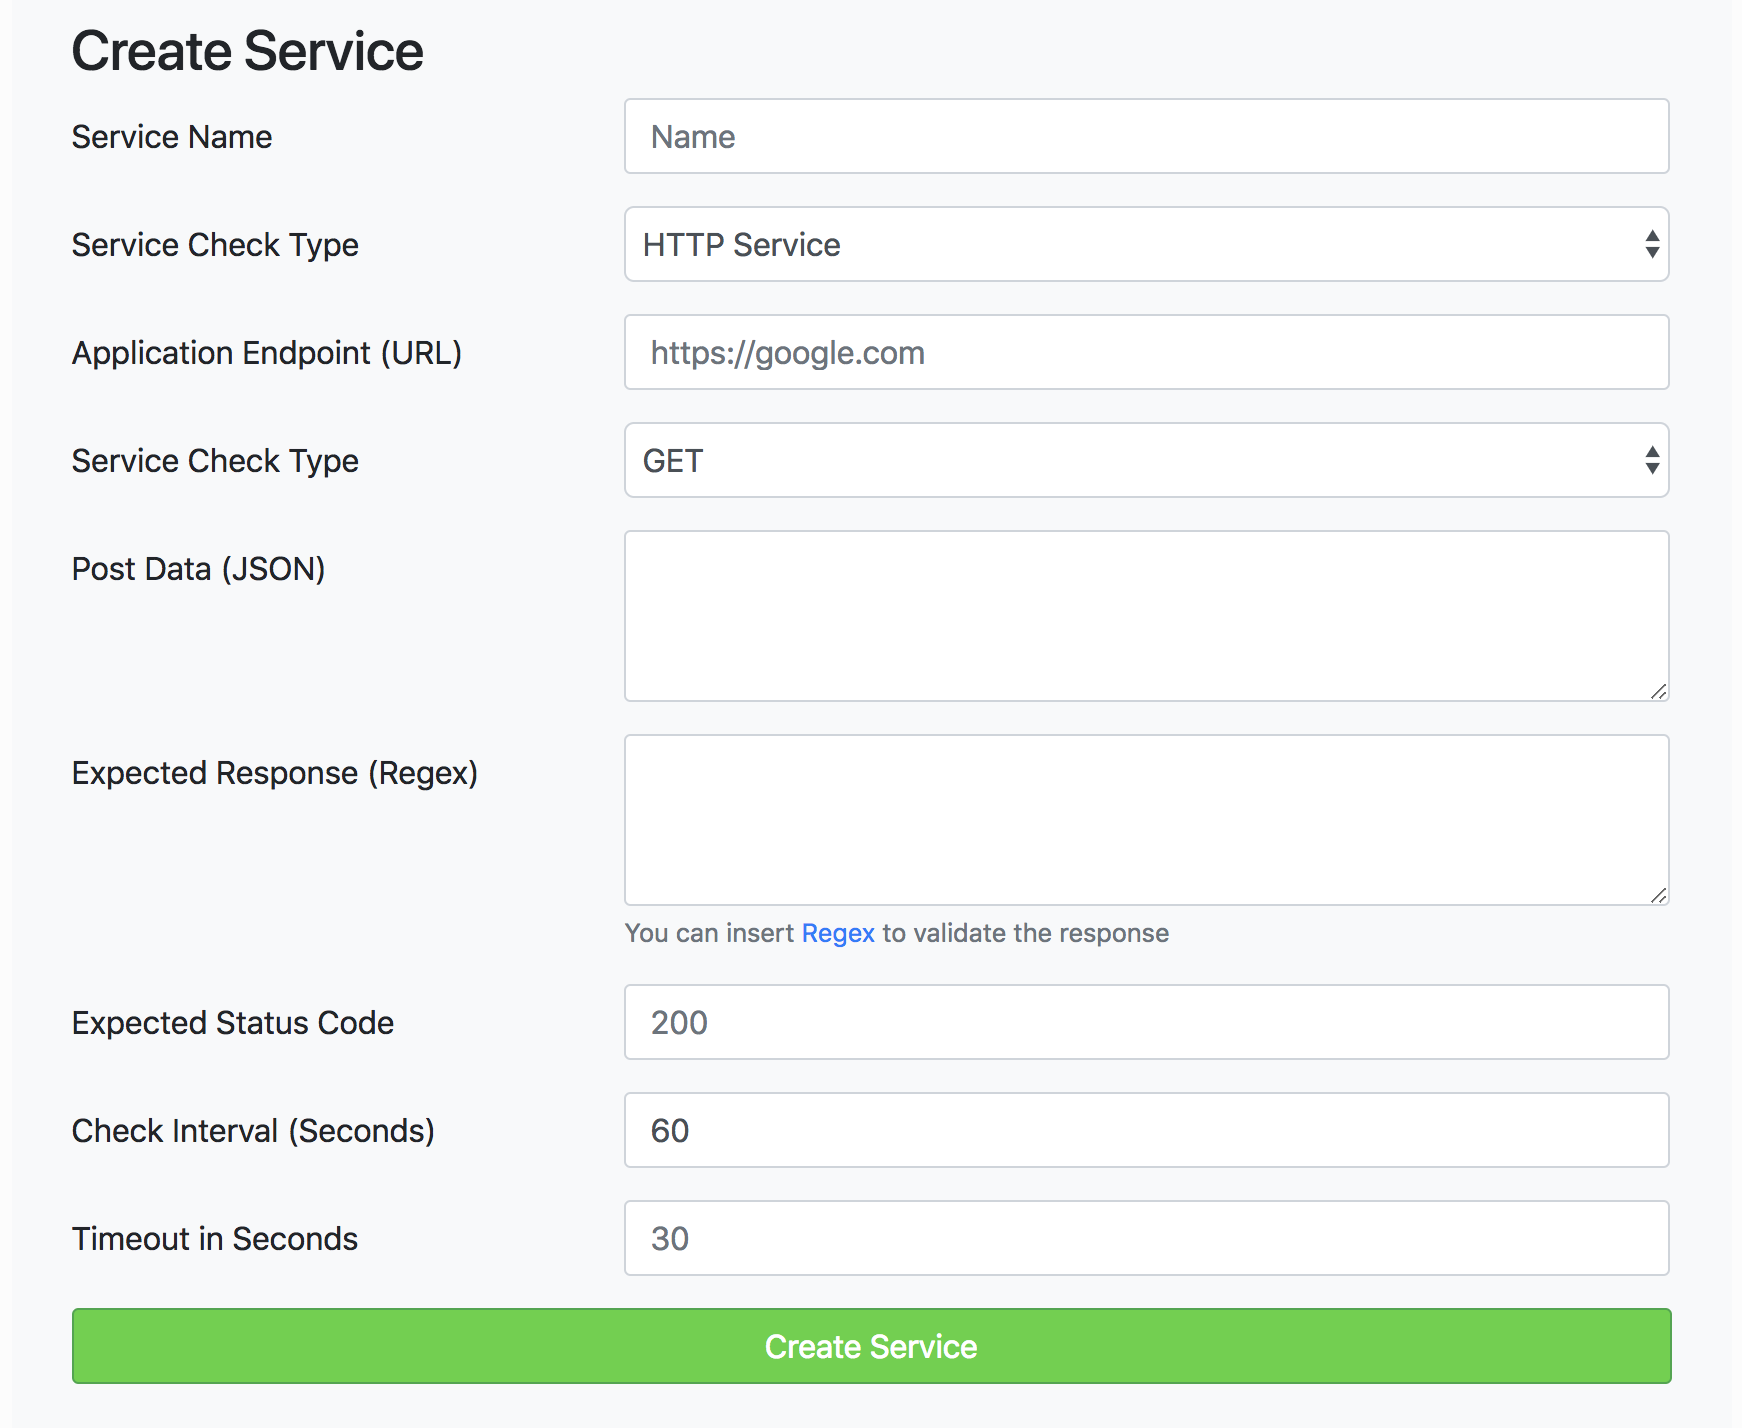
With a HTTP service, you can POST a JSON string to your endpoint to retrieve any type of response back. You can then use Regex in the Expected Response field to parse a custom response that exactly matches your status requirements.
TCP/UDP Services
For other services that don’t use HTTP, you can monitor any type of service by using the PORT of the service. If you’re Ethereum Blockchain server is running on 8545, you can use TCP to monitor your server. With a TCP service, you can monitor your Docker containers, or remove service running on a custom port. You don’t need to include http in the endpoint field, just IP or Hostname.

ICMP Service
You can send a ICMP (ping) to an endpoint rather than HTTP/TCP/UDP request for a quick response. For this service is fully work, you may need to run Statping as a sudo user.
Notifiers
Statping includes multiple Notifiers to alert you when your services are offline. You can also create your own notifier and send a Push Request to this repo! Creating a custom notifier is pretty easy as long as you follow the requirements. A notifier will automatically be installed into the users Statping database, and form values will save without any hassles. 💃
Example Code | Events | View Notifiers
Notifier Requirements
- Must have a unique
METHODname - Struct must have
*notifier.Notificationpointer in it. - Must create and add your notifier variable in
init() - Should have a form for user to input their variables/keys.
Form: []notifier.NotificationForm
Notifier Interface (required)
Statping has the Notifier interface which you’ll need to include in your notifier. Statping includes many other events/triggers for your notifier, checkout Notifier Events to see all of them.
// Notifier interface is required to create a new Notifier
type Notifier interface {
        // OnSuccess is triggered when a service is successful
	OnSuccess(*services.Service) error
        // OnFailure is triggered when a service is failing
	OnFailure(*services.Service, *failures.Failure) error
        // OnTest is triggered for testing
	OnTest() (string, error)
}
var example = &Example{¬ifier.Notification{
Method: "example", // unique method name
Host: "http://exmaplehost.com", // default 'host' field
Form: []notifier.NotificationForm{{
Type: "text", // text, password, number, or email
Title: "Host", // The title of value in form
Placeholder: "Insert your Host here.", // Optional placeholder in input
DbField: "host", // An accepted DbField value (read below)
}},
}
Notifier Form
Include a form with your notifier so other users can save API keys, username, passwords, and other values.
// NotificationForm contains the HTML fields for each variable/input you want the notifier to accept.
type NotificationForm struct {
	Type        string `json:"type"`        // the html input type (text, password, email)
	Title       string `json:"title"`       // include a title for ease of use
	Placeholder string `json:"placeholder"` // add a placeholder for the input
	DbField     string `json:"field"`       // true variable key for input
	SmallText   string `json:"small_text"`  // insert small text under a html input
	Required    bool   `json:"required"`    // require this input on the html form
	IsHidden    bool   `json:"hidden"`      // hide this form element from end user
	IsList      bool   `json:"list"`        // make this form element a comma separated list
	IsSwitch    bool   `json:"switch"`      // make the notifier a boolean true/false switch
}
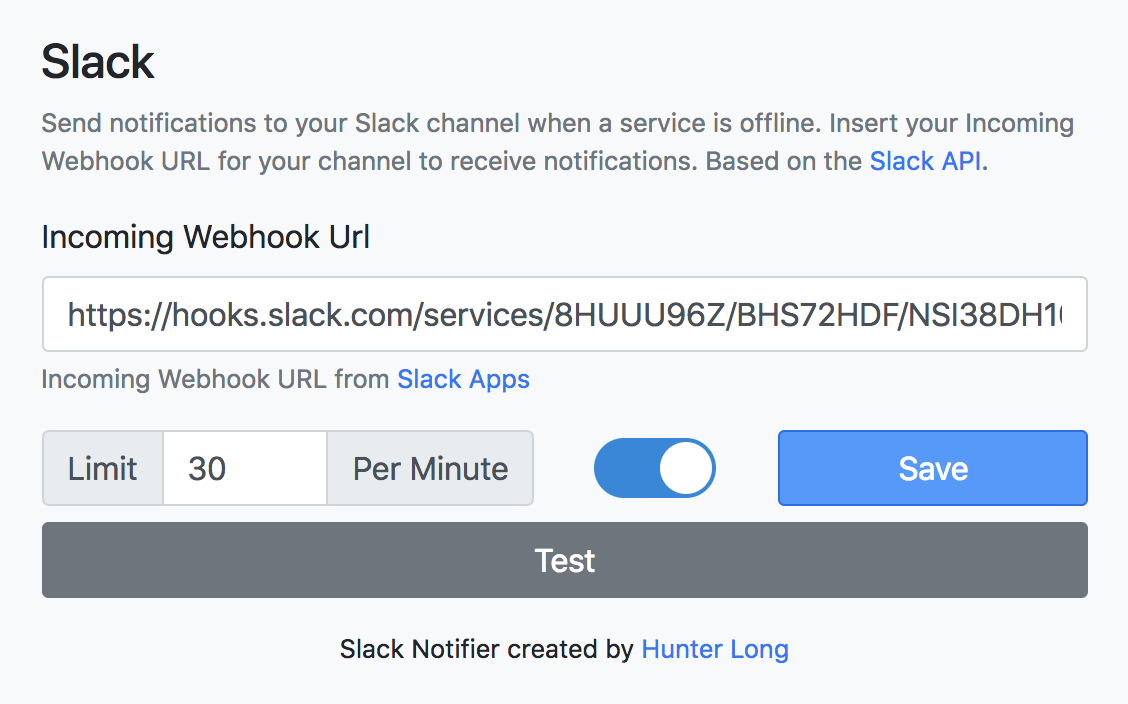
Example Notifier Form
This is the Slack Notifier Form fields.
Form: []notifier.NotificationForm{{
		Type:        "text",
		Title:       "Incoming webhooker Url",
		Placeholder: "Insert your slack webhook URL here.",
		SmallText:   "Incoming webhooker URL from <a href=\"https://api.slack.com/apps\" target=\"_blank\">slack Apps</a>",
		DbField:     "Host",
		Required:    true,
	}}
}
Accepted DbField Values
The notifier.NotificationForm has a field called DbField which is the column to save the value into the database. Below are the acceptable DbField string names to include in your form.
- host used for a URL or API endpoint
- username used for a username
- password used for a password
- port used for a integer port number
- api_key used for some kind of API key
- api_secret used for some API secret
- var1 used for any type of string
- var2 used for any type of string (extra)
Form Elements
You can completely custom your notifications to include a detailed form.
- Type is a HTML input type for your field
- Title give your input element a title
- Placeholder optional field if you want a placeholder in input
- DbField required field to save variable into database (read above)
- Placeholder optional field for inserting small hint under the input
Adding Notifiers
To add a notifier to the Statping application, simply append your Notifier in the AttachNotifiers() function inside of core/core.go.
// AttachNotifiers will attach all the notifier's into the system
func AttachNotifiers() error {
	return notifier.AddNotifiers(
		notifiers.Command,
		notifiers.Discorder,
		notifiers.Emailer,
		notifiers.LineNotify,
		notifiers.Mobile,
		notifiers.Slacker,
		notifiers.Telegram,
		notifiers.Twilio,
		notifiers.Webhook,
	)
}
AttachNotifiers
Issues and Solutions
If you have issues with your Statping instance, this page will help you solve them. Before doing anything, I recommend updating to the latest version of Statping.
Update to Latest Version
Updating Statping is very simple, you can choose one of the options below:
- Run command: statping update (you may need to run sudo depending on your server)
- or Run command: curl -o- -L https://statping.com/install.sh | bash
- or download tar.gz file from Latest Releases and extract for statping.
Blank/White Page
If your Statping instance is only showing a blank white page, this means there’s an issue with CSS or JS assets.
- Update to the latest version of Statping
- Delete the assets folder if you have one
- Restart Statping instance
Database Migration Errors
If you notice a database error during migration, you can reset your Statping instance while keeping previous data so you won’t have to re-input.
- In your Statping directory (contains config.yml) run command: statping export. This will export all elements into a timestamped JSON file. This file will not include previous hits or failures.
- Delete assets folder if you have one.
- Delete and Recreate MySQL, Postgres database, or delete statping.db.
- Import previous data by running: statping import backup.json (replace backup.json with your exported filename)
Deleting Old Records
DELETE FROM hits WHERE created_at < '2020-02-21 00:00:00';// Delete hits older thanDELETE FROM failures WHERE created_at < '2020-02-21 00:00:00';// Delete failures older than
Bulk Import Services
You can import multiple services when Statping first loads by creating a file named services.yml in the working directory for Statping. It will insert the new service into the database, and will not be re-added on reboot. All services must be an array under the services: field.
Dynamic Yaml
With Yaml, you can insert “anchors” to make receptive fields simple! Checkout the example below. The &tcpservice anchor will return all the fields belonging to x-tcpservice:. To reuse these fields for each service, you can insert <<: *tcpservice and thats it!
x-tcpservice: &tcpservice
  type: tcp
  check_interval: 60
  timeout: 15
  allow_notifications: true
  notify_after: 0
  notify_all_changes: true
  public: true
  redirect: true

x-httpservice: &httpservice
  type: http
  method: GET
  check_interval: 45
  timeout: 10
  expected_status: 200
  allow_notifications: true
  notify_after: 2
  notify_all_changes: true
  public: true
  redirect: true

services:

  - name: Statping Demo
    domain: https://demo.statping.com
    <<: *httpservice

  - name: Portainer
    domain: portainer
    port: 9000
    <<: *tcpservice

  - name: Statping Github
    domain: https://github.com/statping/statping
    <<: *httpservice
Duplicates
Services that have already been added into the database will not be added again. This is done by creating a SHA256 hash of the following fields…
sha256(name:EXAMPLEdomain:HTTP://DOMAIN.COMport:8080type:HTTPmethod:GET)
Environment Variables
This page will list all environment variables that could be passed into Statping. You can see all default values in utils/env.go file under the InitEnvs() function.
Statping Server
PORT- Set the outgoing port for the HTTP server (or use –port, default: 8080)HOST- Bind a specific IP address to the HTTP server (or use –ip)VERBOSE- Display more logs in verbose mode. (1 - 4)STATPING_DIR- Set a absolute path for the root path of Statping server (logs, assets, SQL db)DISABLE_LOGS- Disable viewing and writing to the log file (default is false)GO_ENV- Run Statping in testmode, will bypass HTTP authentication (if set as ‘test’)REMOVE_AFTER- Automatically delete records after time (default 3 months, ‘12h = 12 hours’)CLEANUP_INTERVAL- Interval to check for old records (default 1 hour, ‘1h = 1 hour’)ALLOW_REPORTS- Send Statping anonymous error reports so we can see issues (default is false)SERVER_PORT- Port number to run Statping HTTP server on (or use -p/–port)
Automatic SSL Certificate
With LetsEncrypt enabled, Statping will run through the SSL process and create the SSL certs in the certs folder. Read more about the SSL Process on the SSL Wiki.
- LETSENCRYPT_ENABLE - Set to true to have LetsEncrypt enabled. (defaults to false)
- LETSENCRYPT_HOST - Domain to generate SSL certificate
- LETSENCRYPT_EMAIL - Email address that gets sent with the LetsEncrypt Request
- LETSENCRYPT_LOCAL - Set for LetsEncrypt testing
Database
DB_CONN- Database connection (sqlite, postgres, mysql) Will automatically start if set to ‘sqlite’DB_HOST- Database hostname or IP addressDB_USER- Database usernameDB_PASS- Database passwordDB_PORT- Database port (5432, 3306, …)DB_DATABASE- Database connection’s database nameDB_DSN- Database DSN string (postgres, mysql, sqlite)READ_ONLY- Run in a read only mode, this will not create, update, or delete records (false)POSTGRES_SSLMODE- Enable Postgres SSL Mode ‘ssl_mode=VALUE’ (enable/disable/verify-full/verify-ca)MAX_OPEN_CONN- Set Maximum Open Connections for database server (default: 25)MAX_IDLE_CONN- Set Maximum Idle Connections for database server (default: 25)MAX_LIFE_CONN- Set Maximum Life Connections for database server (default: 5 minutes)PREFIX- Add a prefix string to each Prometheus metric (default is empty)
Connection
BASE_PATH- Set the base URL prefix (set to ‘monitor’ if URL is domain.com/monitor)PREFIX- A Prefix for each value in Prometheus /metric exporterHTTP_PROXY- Use a HTTP Proxy for HTTP RequestsAUTH_USERNAME- HTTP Basic Authentication usernameAUTH_PASSWORD- HTTP Basic Authentication passwordDISABLE_HTTP- Disable HTTP server if set to trueDISABLE_COLORS- Disable colors in terminal logs if set to trueDEBUG- Enables pprof golang debugging on port 9090LOGS_MAX_COUNT- Maximum amount of log files (defaults to 5)LOGS_MAX_AGE- Maximum age for log files (defaults to 28 days)LOGS_MAX_SIZE- Maximum size for log files (defaults to 16 MB)LANGUAGE- Language to use (en, fr, it, ru, zh, de, ko, ja)Assets
SASS- Set the absolute path to the sass binary location (find withwhich sass)USE_ASSETS- Automatically use assets from ‘assets folder’ (true/false)
If you have issues with Statping not loading frontend files, delete the assets folder and reboot.
Automatic Fills
NAME- Set a name for the Statping status pageDESCRIPTION- Set a description for the Statping status pageDOMAIN- Set a URL for the Statping status pageADMIN_USER- Username for administrator account (default: admin)ADMIN_PASSWORD- Password for administrator account (default: admin)API_SECRET- Set a custom API Secret for API AuthenticationSAMPLE_DATA- Insert sample services, groups and more (default: true)
Testing
If you want to test your updates with the current golang testing units, you can follow the guide below to run a full test process. Each test for Statping will run in MySQL, Postgres, and SQlite to make sure all database types work correctly.
Requirements
- Golang (1.14.* or whichever
go.modstates)- go.rice Compiles all assets into golang file
- Node (currently using
10.17)- Yarn
- Sass

Basic Testing
The easiest way to run local unit testing by using SQLite and following the commands below…
1. Make sure you have the requirements above. (being able to run rice)
2. cd frontend && yarn Install npm packages for the frontend
3. make compile Creates production version of Vue frontend and compiles all assets with rice.
4. make install Will install statping locally so your system test CLI commands/flags.
5. go test -v ./... Run all tests for Statping.
If you run Statping on port 8585, and then run
yarn devthe debug Vue server will be running on port 8888.
Notifier Testing
To test the notifiers, you must include an environment variable that is set in each notifier test. If that notifier test environment variable is not set, it will be skipped.
Create Docker Databases
For more advanced testing, you can connect to a different type of database by using the DB_CONN environment variable. You can start them with Docker. Docker is available for Linux, Mac and Windows. You can download/install it by going to the Docker Installation site.
docker run -it -d \
   -p 3306:3306 \
   -env MYSQL_ROOT_PASSWORD=password123 \
   -env MYSQL_DATABASE=root mysql
docker run -it -d \
   -p 5432:5432 \
   -env POSTGRES_PASSWORD=password123 \
   -env POSTGRES_USER=root \
   -env POSTGRES_DB=root postgres
Once you have MySQL and Postgres running, you can begin the testing. SQLite database will automatically create a statping.db file and will delete after testing.
Run Tests
Insert the database environment variables to auto connect the the databases and run the normal test command: go test -v ./.... You’ll see a verbose output of each test. If all tests pass, make a push request! 💃
DB_CONN=sqlite \
DB_DATABASE=root \
DB_USER=root \
DB_PASS=password123 \
DB_HOST=localhost \
go test -v ./...
Badges
Using shields.io you can easily create Badges for your services. Using the URL below, you can format your own SVG badge:
https://img.shields.io/badge/dynamic/json?url=<URL>&label=<LABEL>&query=<$.DATA.SUBDATA>&color=<COLOR>&prefix=<PREFIX>&suffix=<SUFFIX>
url- URL for JSON endpointlabel- Text for the left side of the badgequery- JSON Path to be set for right side value
Examples
Service Uptime Percent
- URL: https://demo.statping.com/api/services/1
- JSON Path:
$.online_24_hours - Suffix:
%
https://img.shields.io/badge/dynamic/json?color=blue&label=%20Statping%20Uptime&query=%24.online_24_hours&url=https%3A%2F%2Fdemo.statping.com%2Fapi%2Fservices%2F1&suffix=%
Count Services
- URL: https://demo.statping.com/health
- JSON Path:
$.services - Suffix:
services
https://img.shields.io/badge/dynamic/json?color=purple&label=Demo%20Site&query=%24.services&url=https://demo.statping.com/health&suffix=%20services
Contributing
Have a feature you want to implement into Statping!? Awesome! Follow this guide
to see how you can test, compile and build Statping for production use. I
recommend you use make with this process, it will save you time and it will
auto-include many customized parameters to get everything working correctly.
Send all PR’s to
devbranch!
Requirements
- Golang
1.14 - Node
10.15.3
Dependencies
Statping has a couple of required dependencies when testing and compiling the binary. The Makefile will make these tasks a lot easier. Take a look at the Makefile to see what commands are running. Run the command below to get setup right away.
make clean compile build
List of requirements for compiling assets, building binary, and testing.
- Go Language
- Docker
- SASS
- Cypress (only used for UI testing, make cypress-install)
Compiling Assets
This Golang project uses rice to
compile static assets into a single file. The file source/rice-box.go is never
committed to the Github repo, it is automatically created on the build. Statping
also requires sass to be installed on your local OS. To compile all the
static assets run the command below:
make compile
After this is complete, you’ll notice the source/rice-box.go file has been
generated. You can now continue to build, and test.
Testing
Statping includes multiple ways to Test the application, you can run the make
command, or the normal go test command. To see the full experience of your
updates, you can even run Cypress tests which are in the .dev/test folder.
Statping will run all tests in the cmd folder on MySQL, Postgres, and SQLite
databases. You can run make databases to automatically create MySQL and
Postgres with Docker.
Golang Testing:
make test
Cypress UI Testing:
make cypress-test
Test Everything:
make test-all
Build
Statping will build on all operating systems except Windows 32-bit. I personally use xgo to cross-compile on multiple systems using Docker. Follow the commands below to build on your local system.
Build for local operating system:
make compile build
Compile for Production
Once you’ve tested and built locally, you can compile Statping for all available operating systems using the command below. This command will require you to have Docker.
make build-all
What Now
Everything tested, compiled and worked out!? Awesome! 💃 You can now commit your changes, and submit a Pull Request with the features/bugs you added or removed.
Please remember to also add the Changelog Entry to describe what you have changed by usingchangelog-go.
If your PR is related to an Issue (ie. on a bug fix or when adding a new notifier)
don’t forget adding the related GitHub Issue ID like this: [#270](https://github.com/statping/statping/issues/270)
Check out the example below.
Adding one changelog entry should be done in a separate Commit - not only
because this is a good Committing practice, also because it’s separated by your
Changes.
When you fix/ add/ … more than one thing than please describe it a good, short
and precise sentence. Because everyone wants a good and nice-looking CHANGELOG.md
where all changes of a new Version are documented.
Example for fixing a bug in the UI
~] changelog new "Fix zooming out on graph doesn't load additional data ([#270](https://github.com/statping/statping/issues/270))"
[0] New Feature          (Added)
[1] Bug Fix              (Fixed)
[2] Feature change       (Changed)
[3] New deprecation      (Deprecated)
[4] Feature removal      (Removed)
[5] Security fix         (Security)
[6] Other                (Other)
>> 1
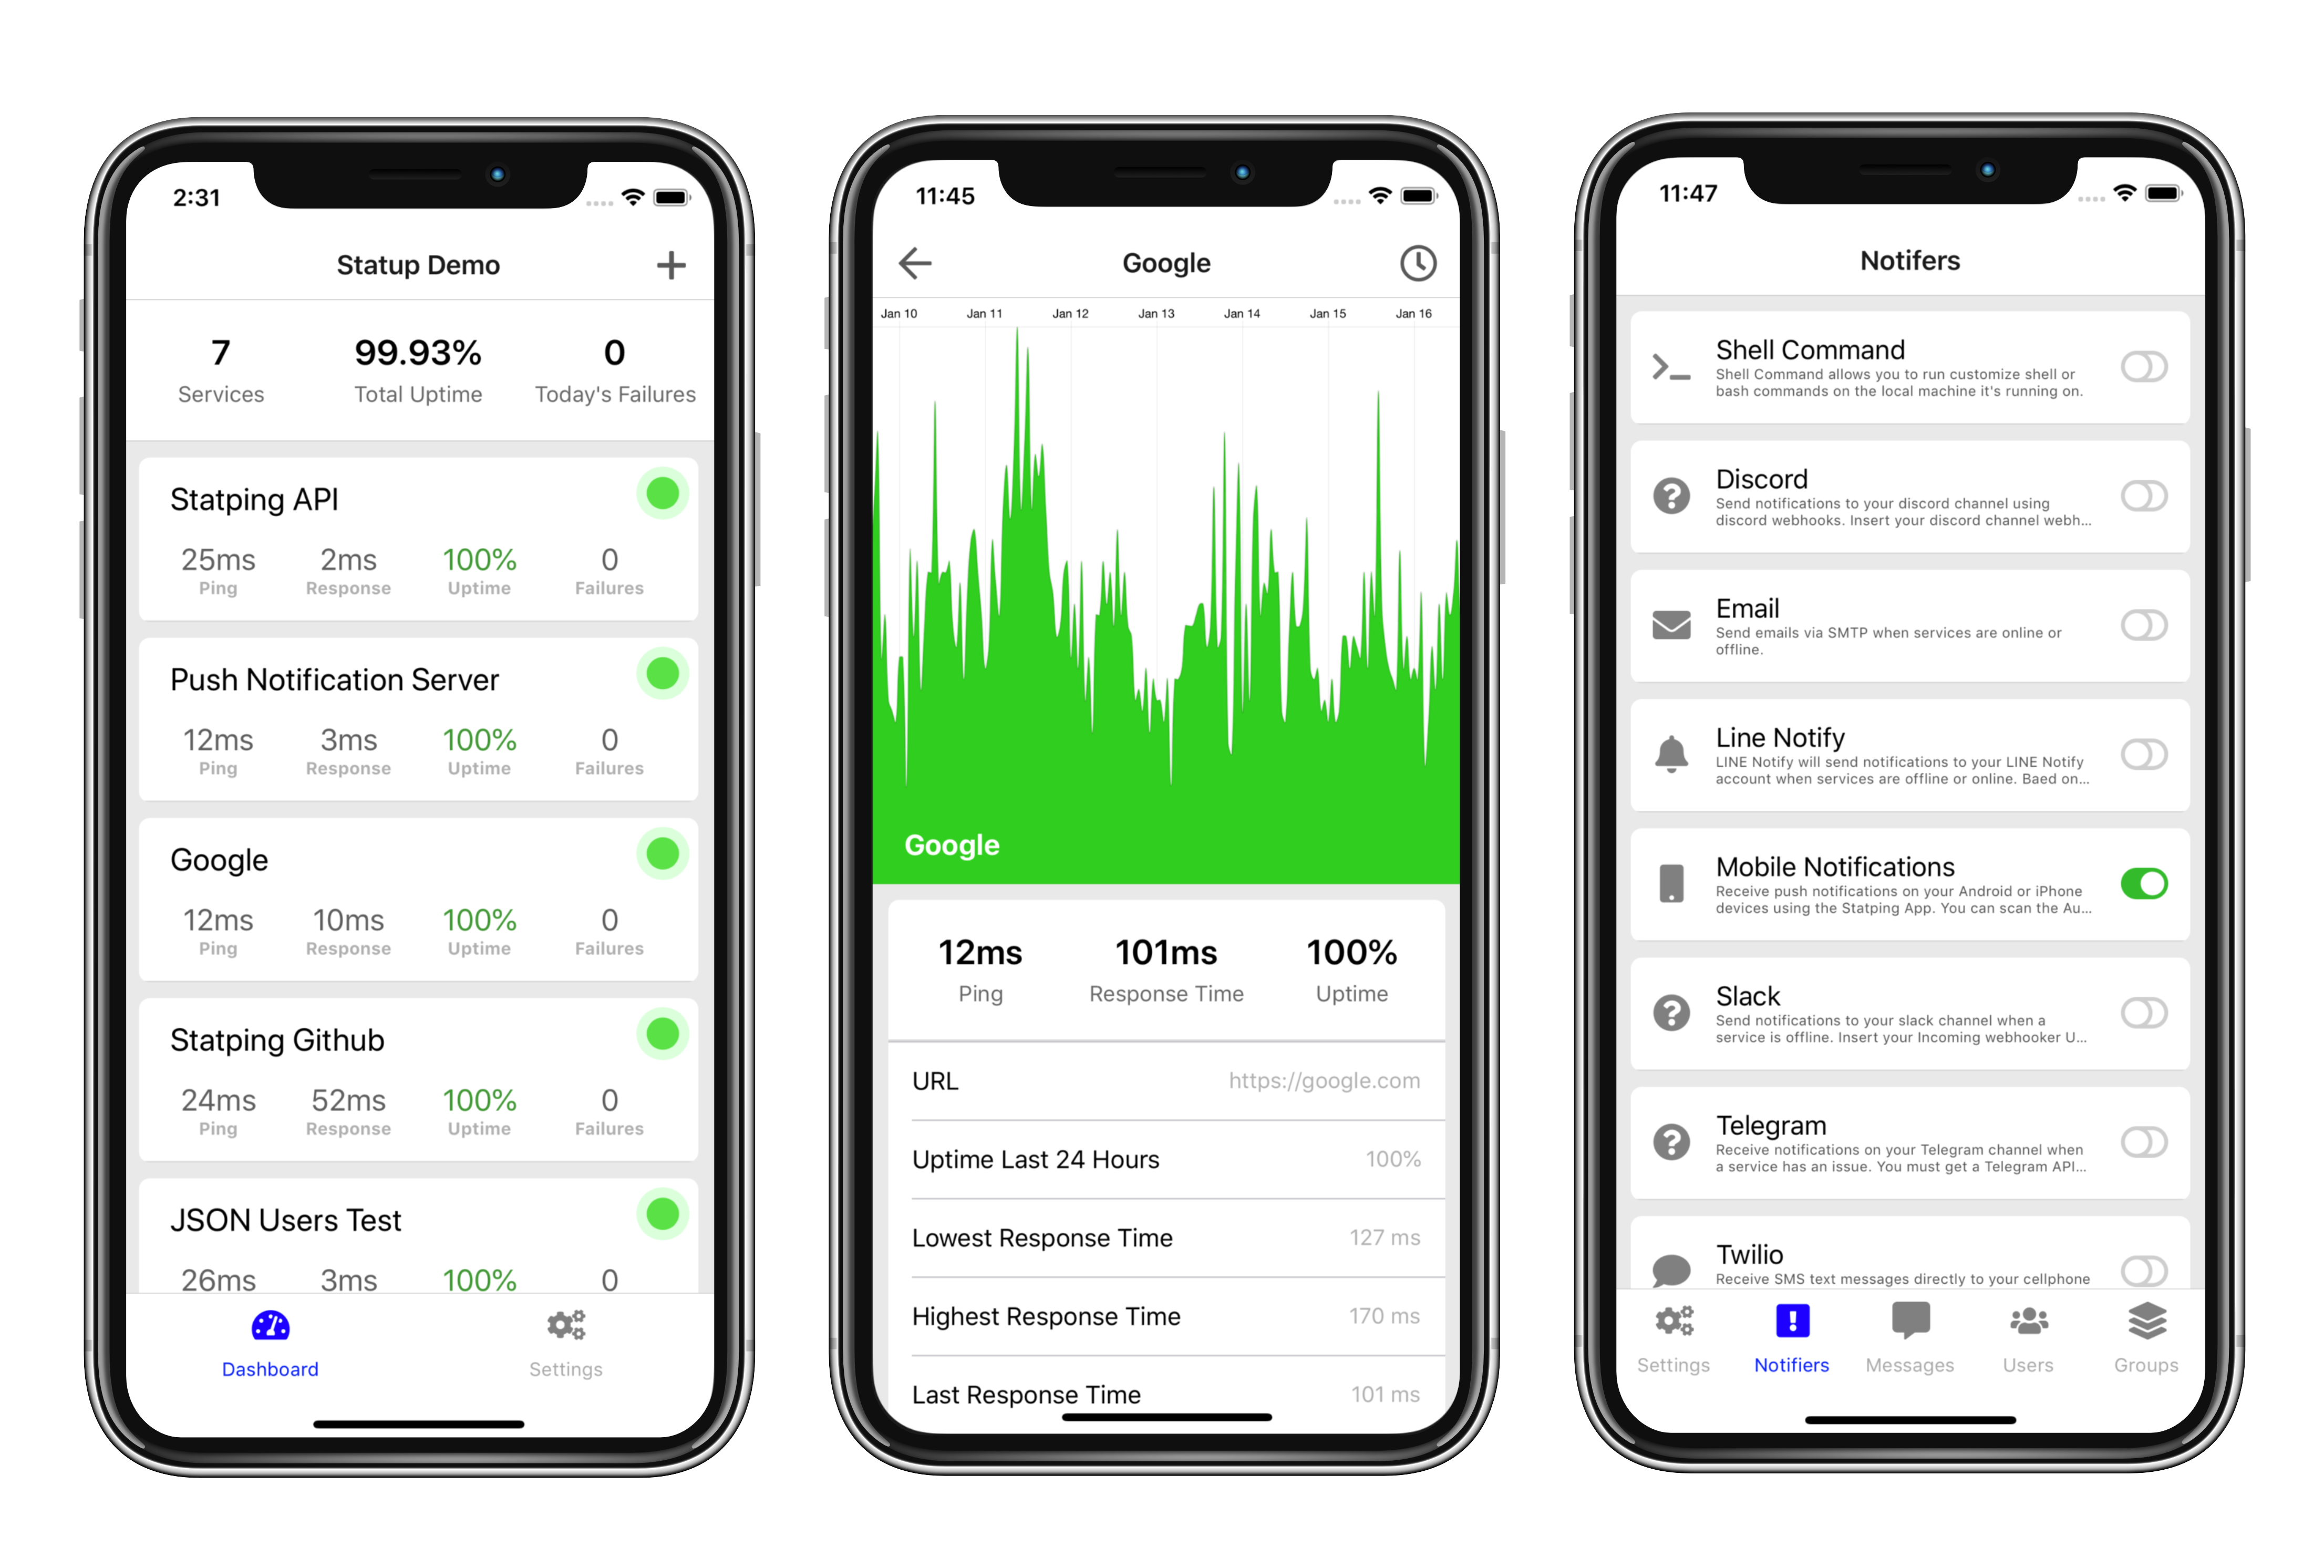
Mobile App
Statping has a free mobile app so you can monitor your websites and applications without the need of a computer.


![]()
Docker
Statping is easily ran on Docker with the light weight Alpine linux image. View on Docker Hub.


Volume Mount
/app- Working directory in container. This directory will hold all configs, logs, assets, and sqlite database.
Latest Docker Image
The latest Docker image uses Alpine Linux to keep it ultra small.
docker run -d \
  -p 8080:8080 \
  --restart always \
  statping/statping
Mounting Volume
You can mount a volume to the /app Statping directory. This folder will contain logs, config.yml, and static assets if you want to edit the SCSS/CSS.
docker run -d \
  -p 8080:8080 \
  -v /mydir/statping:/app \
  --restart always \
  statping/statping
Attach a SSL Certificate
When you mount server.crt and server.key to the /app directory, Statping will run a HTTPS server on port 443. Checkout the SSL Wiki documentation to see more information about this.
docker run -d \
  -p 443:443 \
  -v /mydir/domain.crt:/app/server.crt \
  -v /mydir/domain.key:/app/server.key \
  -v /mydir:/app \
  --restart always \
  statping/statping
Development Docker Image
If you want to run Statping that was build from the source, use the dev Docker image.
docker run -d -p 8080:8080 statping/statping:dev
Cypress Testing Docker Image
This Docker image will pull the latest version of Statping and test the web interface with Cypress.
docker run -it -p 8080:8080 statping/statping:cypress
Or use Docker Compose
This Docker Compose file inlcudes NGINX, Postgres, and Statping.
Docker Compose with NGINX and Postgres
Once you initiate the docker-compose.yml file below go to http://localhost and you’ll be forwarded to the /setup page.
Database Authentication
- database: postgres
- port: 5432
- username: statup
- password: password123
- database: statup
version: '2.3'

services:

  nginx:
    container_name: nginx
    image: jwilder/nginx-proxy
    ports:
      - 0.0.0.0:80:80
      - 0.0.0.0:443:443
    networks:
      - internet
    restart: always
    volumes:
      - /var/run/docker.sock:/tmp/docker.sock:ro
      - ./statup/nginx/certs:/etc/nginx/certs:ro
      - ./statup/nginx/vhost:/etc/nginx/vhost.d
      - ./statup/nginx/html:/usr/share/nginx/html:ro
      - ./statup/nginx/dhparam:/etc/nginx/dhparam
    environment:
      DEFAULT_HOST: localhost

  statup:
    container_name: statup
    image: statping/statping:latest
    restart: always
    networks:
      - internet
      - database
    depends_on:
      - postgres
    volumes:
      - ./statup/app:/app
    environment:
      VIRTUAL_HOST: localhost
      VIRTUAL_PORT: 8080
      DB_CONN: postgres
      DB_HOST: postgres
      DB_USER: statup
      DB_PASS: password123
      DB_DATABASE: statup
      NAME: EC2 Example
      DESCRIPTION: This is a Statping Docker Compose instance

  postgres:
    container_name: postgres
    image: postgres:10
    restart: always
    networks:
      - database
    volumes:
      - ./statup/postgres:/var/lib/postgresql/data
    environment:
      POSTGRES_PASSWORD: password123
      POSTGRES_USER: statup
      POSTGRES_DB: statup

networks:
  internet:
    driver: bridge
  database:
    driver: bridge
Or a simple wget…
wget https://raw.githubusercontent.com/statping/statping/master/servers/docker-compose.yml
docker-compose up -d
Docker Compose with Automatic SSL
You can automatically start a Statping server with automatic SSL encryption using this docker-compose file. First point your domain’s DNS to the Statping server, and then run this docker-compose command with DOMAIN and EMAIL. Email is for letsencrypt services.
wget https://raw.githubusercontent.com/statping/statping/master/servers/docker-compose-ssl.yml

LETSENCRYPT_HOST=mydomain.com \
    LETSENCRYPT_EMAIL=info@mydomain.com \
    docker-compose -f docker-compose-ssl.yml up -d
Full docker-compose with Automatic SSL
version: '2.3'

services:

  nginx:
    container_name: nginx
    image: jwilder/nginx-proxy
    ports:
      - 0.0.0.0:80:80
      - 0.0.0.0:443:443
    labels:
      - "com.github.jrcs.letsencrypt_nginx_proxy_companion.nginx_proxy"
    networks:
      - internet
    restart: always
    volumes:
      - /var/run/docker.sock:/tmp/docker.sock:ro
      - ./statup/nginx/certs:/etc/nginx/certs:ro
      - ./statup/nginx/vhost:/etc/nginx/vhost.d
      - ./statup/nginx/html:/usr/share/nginx/html:ro
      - ./statup/nginx/dhparam:/etc/nginx/dhparam
    environment:
      DEFAULT_HOST: ${LETSENCRYPT_HOST}

  letsencrypt:
    container_name: letsencrypt
    image: jrcs/letsencrypt-nginx-proxy-companion
    networks:
      - internet
    restart: always
    volumes:
      - /var/run/docker.sock:/var/run/docker.sock:ro
      - ./statup/nginx/certs:/etc/nginx/certs
      - ./statup/nginx/vhost:/etc/nginx/vhost.d
      - ./statup/nginx/html:/usr/share/nginx/html
      - ./statup/nginx/dhparam:/etc/nginx/dhparam

  statup:
    container_name: statup
    image: statping/statping:latest
    restart: always
    networks:
      - internet
      - database
    depends_on:
      - postgres
    volumes:
      - ./statup/app:/app
    environment:
      VIRTUAL_HOST: ${LETSENCRYPT_HOST}
      VIRTUAL_PORT: 8080
      LETSENCRYPT_HOST: ${LETSENCRYPT_HOST}
      LETSENCRYPT_EMAIL: ${LETSENCRYPT_EMAIL}
      DB_CONN: postgres
      DB_HOST: postgres
      DB_USER: statup
      DB_PASS: password123
      DB_DATABASE: statup
      NAME: SSL Example
      DESCRIPTION: This Status Status Page should be running ${LETSENCRYPT_HOST} with SSL.

  postgres:
    container_name: postgres
    image: postgres:10
    restart: always
    networks:
      - database
    volumes:
      - ./statup/postgres:/var/lib/postgresql/data
    environment:
      POSTGRES_PASSWORD: password123
      POSTGRES_USER: statup
      POSTGRES_DB: statup

networks:
  internet:
    driver: bridge
  database:
    driver: bridge
Docker-Compose
This page includes multiple docker-compose.yml setups for you to run. There are many environment variables for additional settings and features, checkout the Environment Variables Wiki to see them all.
Database Configurations
-
Web Serving
-
Metrics
-
Grafana with Prometheus
Docker Volumes
/app- Main Volume that you should mount to a directory on the host machine/app/config.yml- Config file/app/logs- Logs folder (rotates every 3 days)/app/assets- Folder containing all CSS, SCSS, JS and other static files (if you use custom styling)/app/statping.db- SQLite database file (if you’re using SQLite) —
Basic SQLite Connection
This docker-compose will start Statping on port 8080 and automatically run on a SQLite database.
statping:
  container_name: statping
  image: statping/statping
  restart: always
  ports:
    - 8080:8080
  volumes:
    - ./statping:/app
  environment:
    DB_CONN: sqlite
MySQL Connection
statping:
  container_name: statping
  image: statping/statping
  restart: always
  depends_on:
    - mysql
  ports:
    - 8080:8080
  volumes:
    - statping_data:/app
  links:
    - mysql
  environment:
    DB_CONN: mysql
    DB_HOST: mysql
    DB_PORT: 3306
    DB_DATABASE: statping
    DB_USER: root
    DB_PASS: password123

mysql:
  image: mysql:5.7
  volumes:
    - mysql_data:/var/lib/mysql
  restart: always
  ports:
    - 3306:3306
  environment:
    MYSQL_ROOT_PASSWORD: password123
    MYSQL_DATABASE: statping
    MYSQL_USER: root
    MYSQL_PASSWORD: password
Postgres
statping:
  container_name: statping
  image: statping/statping
  restart: always
  ports:
    - 8080:8080
  volumes:
    - statping_data:/app
  links:
    - postgres
  depends_on:
    - postgres
  environment:
    DB_CONN: postgres
    DB_HOST: postgres
    DB_PORT: 5432
    DB_DATABASE: statping
    DB_USER: root
    DB_PASS: password123

postgres:
  container_name: postgres
  image: postgres:10.0-alpine
  ports:
    - 5432:5432
  volumes:
    - pg_data:/var/lib/postgresql/data/pg_data
  environment:
    POSTGRES_PASSWORD: password123
    POSTGRES_DB: statping
    POSTGRES_USER: root
    POSTGRES_PORT: 5432
    PGDATA: /var/lib/postgresql/data/pg_data
Nginx Proxy Pass
The jwilder/nginx-proxy Docker image will automatically redirect a domain to a specific container.
statping:
  container_name: statping
  image: statping/statping
  restart: always
  volumes:
    - statping_data:/app
  environment:
    DB_CONN: sqlite
    VIRTUAL_HOST: demo.statping.com
    VIRTUAL_PORT: 8080

nginx:
  container_name: nginx
  image: jwilder/nginx-proxy
  ports:
    - 80:80
  volumes:
    - /var/run/docker.sock:/tmp/docker.sock:ro
Nginx Proxy Pass with SSL (jwilder/nginx-proxy)
Using the jwilder/nginx-proxy image along with jrcs/docker-letsencrypt-nginx-proxy-companion you’ll be able to automatically generate SSL certificates for your Statping instance.
statping:
  container_name: statping
  image: statping/statping
  restart: always
  volumes:
    - statping_data:/app
  environment:
    DB_CONN: sqlite
    LETSENCRYPT_HOST: demo.statping.com
    VIRTUAL_HOST: demo.statping.com
    VIRTUAL_PORT: 8080

nginx:
  container_name: nginx
  image: jwilder/nginx-proxy
  restart: always
  ports:
    - 80:80
    - 443:443
  volumes:
    - /var/run/docker.sock:/tmp/docker.sock:ro
    - cert_volume:/etc/nginx/certs
    - vhost_volume:/etc/nginx/vhost.d
    - html_volume:/usr/share/nginx/html
  environment:
    DEFAULT_HOST: demo.statping.com
  labels:
    - "com.github.jrcs.letsencrypt_nginx_proxy_companion.nginx_proxy=true"

nginx-ssl:
  container_name: nginx-ssl
  image: jrcs/letsencrypt-nginx-proxy-companion
  restart: always
  links:
    - nginx
  volumes:
    - /var/run/docker.sock:/var/run/docker.sock:ro
    - cert_volume:/etc/nginx/certs
    - vhost_volume:/etc/nginx/vhost.d
    - html_volume:/usr/share/nginx/html
  environment:
    DEFAULT_EMAIL: info@mydomain.com
    NGINX_PROXY_CONTAINER: nginx
Grafana Dashboard with Prometheus
Grafana is an awesome metric visualizer that allows you to create some awesome dashboards. We’ve already created a Grafana Dashboard that you can easy import! Checkout the Grafana Wiki and the Prometheus Exporter Wiki for more details.
prometheus.yml config file
This file should be mounted to /etc/prometheus/prometheus.yml in the Prometheus container.
global:
  scrape_interval:     30s
  evaluation_interval: 30s

scrape_configs:
  - job_name: 'statping'
    scrape_interval: 30s
    bearer_token: 'SECRET API KEY HERE'
    static_configs:
      - targets: ['statping:8080']
Be sure to replace
SECRET API KEY HEREwith your API Secret on the Settings page.
docker-compose.yml file for Statping, Grafana and Prometheus
statping:
  container_name: statping
  image: statping/statping
  restart: always
  volumes:
    - statping_data:/app
  environment:
    DB_CONN: sqlite
    LETSENCRYPT_HOST: demo.statping.com
    VIRTUAL_HOST: demo.statping.com
    VIRTUAL_PORT: 8080

prometheus:
  container_name: prometheus
  image: prom/prometheus:v2.0.0
  restart: always
  ports:
    - 9090:9090
  volumes:
    - prometheus.yml:/etc/prometheus/prometheus.yml # config file is above ^
    - prometheus_data:/prometheus
  links:
    - statping
  depends_on:
    - statping

grafana:
  container_name: grafana
  image: grafana/grafana
  restart: always
  ports:
    - 3000:3000
  volumes:
    - grafana_data:/var/lib/grafana
  environment:
    - GF_SECURITY_ADMIN_PASSWORD=password123
    - GF_USERS_ALLOW_SIGN_UP=false
  depends_on:
    - prometheus
  links:
    - prometheus
Traefik
This docker-compose stack will start Statping and Traefik v2.2. You may need to research the Traefik label configs and edit to your own needs. The Traefik server will run on port 80 and 443, and Statping on port 8080.
version: '3.4'

services:

  traefik:
    container_name: traefik
    image: traefik:v2.2.0
    restart: always
    command:
      - --entrypoints.web.address=:80
      - --entrypoints.websecure.address=:443
      - --entrypoints.web.http.redirections.entryPoint.to=websecure
      - --entrypoints.web.http.redirections.entryPoint.scheme=https
      - --entrypoints.websecure.http.tls.certResolver=leresolverresolver
      - --providers.docker
      - --log=true
      - --log.level=INFO
    ports:
      - "80:80"
      - "443:443"
    volumes:
      - /var/run/docker.sock:/var/run/docker.sock:ro
    networks:
      - frontend
    labels:
      - "traefik.enable=true"
      - "traefik.http.routers.traefik.rule=Host(`traefik.statping.com`)"
      - "traefik.http.routers.traefik.service=api@internal"
      - "traefik.http.routers.traefik.middlewares=admin"
      - "traefik.http.routers.traefik.tls.certresolver=leresolver"
      - "traefik.http.routers.traefik.entrypoints=websecure"
      - "traefik.http.routers.http-catchall.entrypoints=web"
      - "traefik.http.routers.http-catchall.rule=HostRegexp(`{host:.+}`)"
      - "traefik.http.routers.http-catchall.middlewares=redirect-to-https"
      - "traefik.http.middlewares.redirect-to-https.redirectscheme.scheme=https"

  statping:
    container_name: statping
    image: statping/statping:latest
    restart: always
    networks:
      - frontend
    volumes:
      - ./statping_data:/app
    environment:
      DB_CONN: sqlite
    labels:
      - "traefik.enable=true"
      - "traefik.http.routers.statping.rule=Host(`demo.statping.com`)"
      - "traefik.http.routers.statping.tls.certresolver=leresolver"
      - "traefik.http.routers.statping.entrypoints=websecure"
      - "traefik.http.services.statping.loadbalancer.server.port=8080"

networks:
  frontend:
    driver: bridge
AWS EC2
Running Statping on the smallest EC2 server is very quick using the AWS AMI Image. The AWS AMI Image will automatically start a Statping Docker container that will automatically update to the latest version. Once the EC2 is booted, you can go to the Public DNS domain to view the Statping installation page. The Statping root folder is located at: /statping on the server.
AMI Image
Choose the correct AMI Image ID based on your AWS region.
- us-east-1 ami-09ccd23d9c7afba61 (Virginia)
- us-east-2 ami-0c6c9b714a501cdb3 (Ohio)
- us-west-1 ami-02159cc1fc701a77e (California)
- us-west-2 ami-007c6990949f5ccee (Oregon)
- eu-central-1 ami-06e252d6d8b0c2f1f (Frankfurt)
Upgrading Statping
You can upgrade the Statping executable by running the commands below on your EC2 instance.
VERSION=$(curl -s "https://github.com/statping/statping/releases/latest" | grep -o 'tag/[v.0-9]*' | awk -F/ '{print $2}')
wget https://github.com/statping/statping/releases/download/$VERSION/statping-linux-x64.tar.gz
tar -xvzf statping-linux-x64.tar.gz
chmod +x statping
mv statping /usr/local/bin/statping
You can test the version number by running statping version.
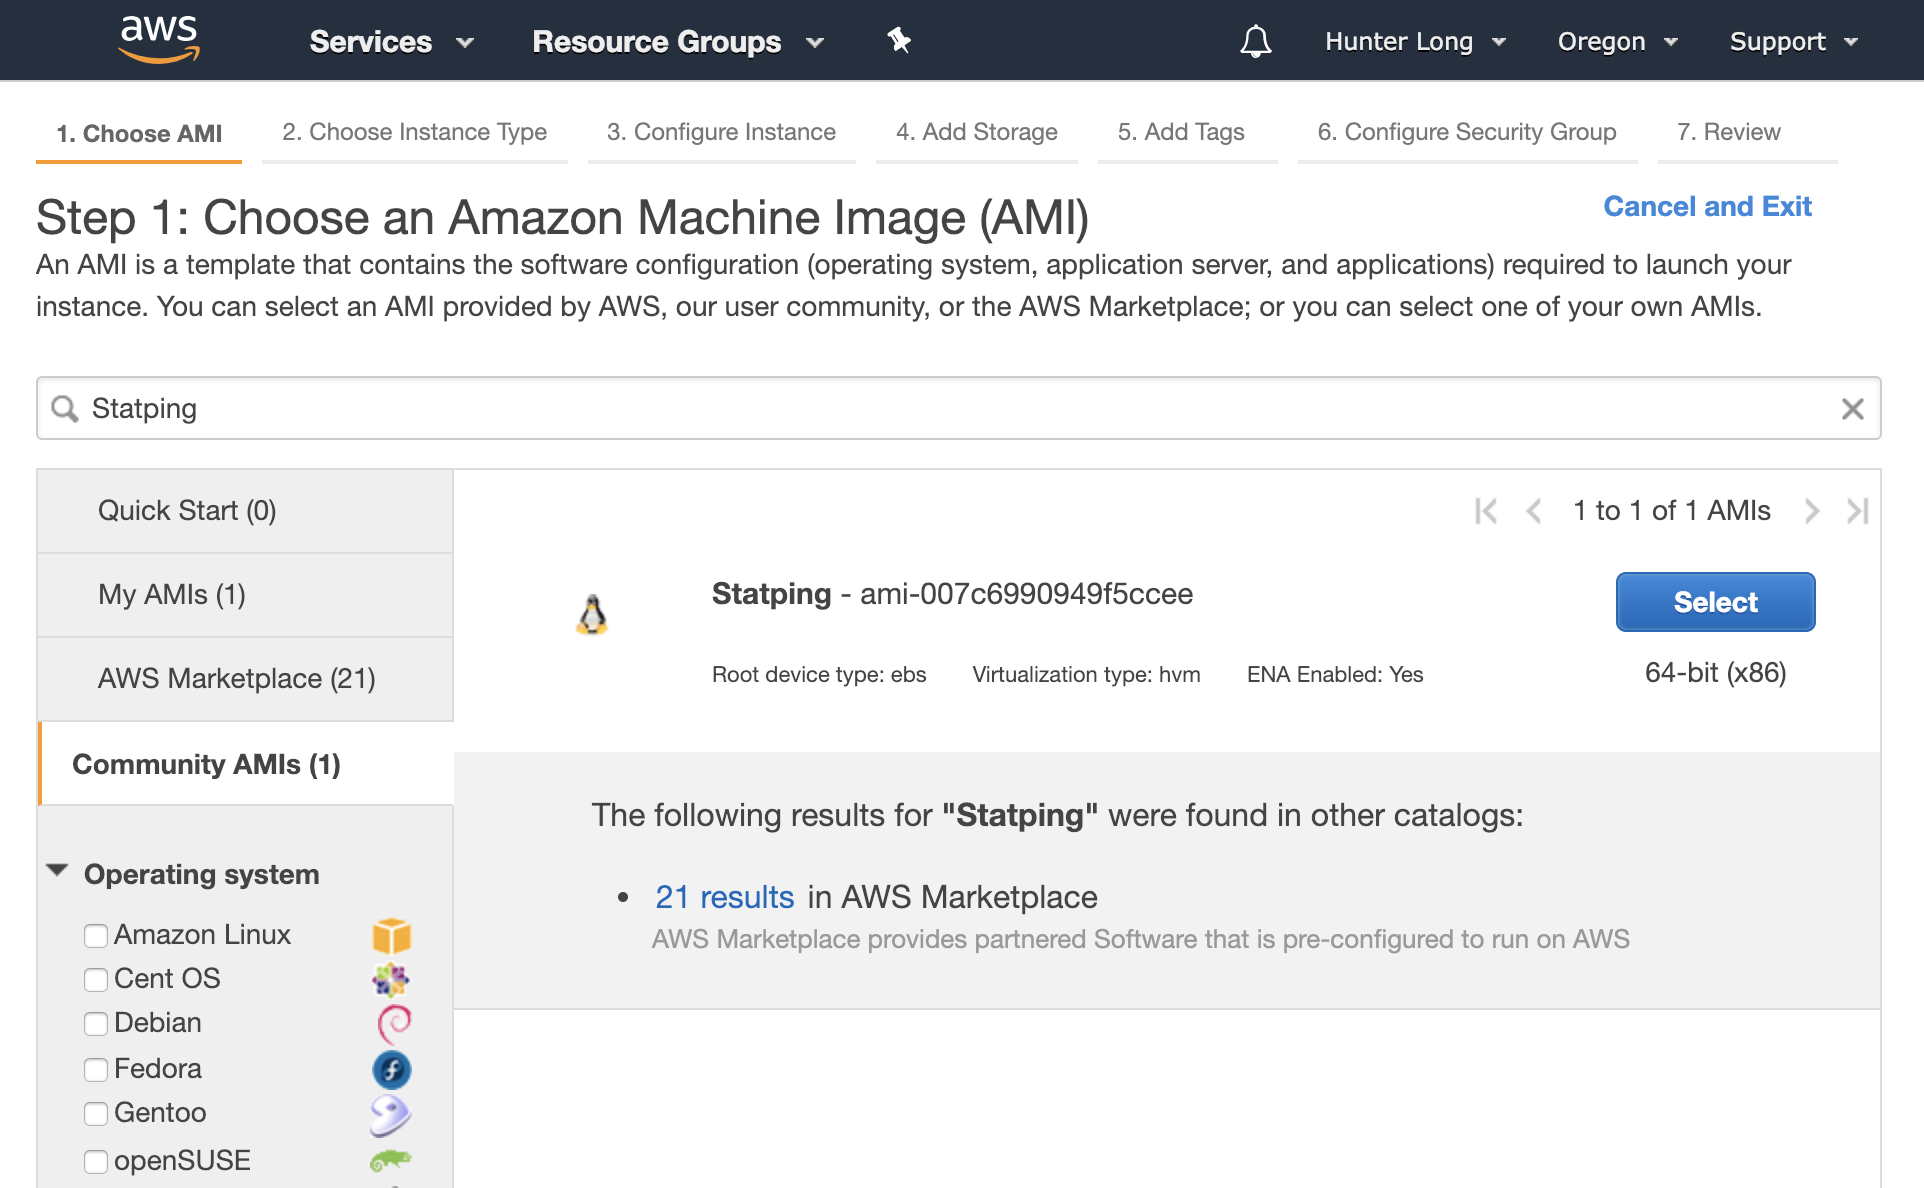
Instructions
1. Create an EC2 instance from AMI Image
Go to the main EC2 dashboard and click ‘Launch Instance’. Then type Statping inside the search field for ‘Community AMI’. Once you’ve found it in your region, click Select!
2. Get the Public DNS for EC2 Instance
Copy the ‘Public DNS’ URL and paste it into your browser.

3. Setup Statping
Use SQLite if you don’t want to connect to a remote MySQL or Postgres database.

EC2 Server Features
Running your Statping server on a small EC2 instance is perfect for most users. Below you’ll find some commands to get up and running in seconds. - Super cheap on the t2.nano (~$4.60 monthly) - Small usage, 8gb of hard drive - Automatic SSL certificate if you require it - Automatic reboot when the server needs it - Automatic database cleanup, so you’ll never be at 100% full. - Automatic docker containers/images removal
Create Security Groups
Using the AWS CLI you can copy and paste the commands below to auto create everything for you. The server opens port 80 and 443.
aws ec2 create-security-group --group-name StatpingPublicHTTP --description "Statping HTTP Server on port 80 and 443"
# will response back a Group ID. Copy ID and use it for --group-id below.
GROUPS=sg-7e8b830f
aws ec2 authorize-security-group-ingress --group-id $GROUPS --protocol tcp --port 80 --cidr 0.0.0.0/0
aws ec2 authorize-security-group-ingress --group-id $GROUPS --protocol tcp --port 443 --cidr 0.0.0.0/0
Create EC2 without SSL
Once your server has started, go to the EC2 Public DNS endpoint. You should be redirected to /setup to continue your installation process! The database information is already inputed for you.
GROUPS=sg-7e8b830f
KEY=MYKEYHERE
AMI_IMAGE=ami-7be8a103

aws ec2 run-instances \
    --image-id $AMI_IMAGE \
    --count 1 --instance-type t2.nano \
    --key-name $KEY \
    --security-group-ids $GROUPS
EC2 Server Specs
- t2.nano ($4.60 monthly)
- 8gb SSD Memory
- 0.5gb RAM
- Docker with Docker Compose installed
- Running Statping, NGINX, and Postgres
- boot scripts to automatically clean unused containers.
Mac
Installing on Mac
Statping includes an easy to use Homebrew Formula to quick get your Status Page up and running locally. Statping on brew is automatically generated for each new release to master. Install with the commands below,
Using Homebrew
brew tap statping/statping
brew install statping
Using the Terminal
curl -o- -L https://statping.com/install.sh | bash

Once you’ve installed it, checkout which version you have by running statping version.
Compiling SCSS for Custom Theme
Statping requires sass to be installed to the local machine to compile SCSS into CSS if you want to use the Custom Theme features.
- Node:
npm install sass -g - Ruby:
gem install sass
Linux
Installing on Linux
Installing and updating Statping on Linux can be done by downloading the latest tar.gz file, unzipping, and running the executable. Or run the install/upgrade script below.
curl -o- -L https://statping.com/install.sh | bash
Install using Snapcraft
If you are using snap, you can simply run this command to install Statping.
sudo snap install statping
![]()
Compiling SCSS for Custom Theme
Statping requires sass to be installed to the local machine to compile SCSS into CSS if you want to use the Custom Theme features.
- Apt:
apt install ruby-sass -y - Node:
npm install sass -g - Ruby:
gem install sass
Systemd Service
Setting up a systemd service is a great way to make sure your Statping server will automatically reboot when needed. You can use the file below for your service. You should have Statping already installed by this step.
/etc/systemd/system/statping.service
[Unit]
Description=Statping Server
After=network.target
After=systemd-user-sessions.service
After=network-online.target

[Service]
Type=simple
Restart=always
ExecStart=/usr/local/bin/statping
WorkingDirectory=/usr/local/bin

[Install]
WantedBy=multi-user.target
Then you can enable and start your systemd service with:
systemctl daemon-reload

systemctl enable statping.service

systemctl start statping
You’re Statping server will now automatically restart when your server restarts.
Please note that Statping’s files (logs, config and database) will be created inside “/usr/local/bin/” after the service is ran for the first time, unless you change “WorkingDirectory” configuration option in the systemd service configuration as seen above.
Raspberry Pi
You can even run Statping on your Raspberry Pi by installing the precompiled binary from Latest Releases. For the Raspberry Pi 3 you’ll want to download the statping-linux-arm7.tar.gz file. Be sure to change VERSION to the latest version in Releases, and include the ‘v’.
VERSION=$(curl -sL "https://github.com/statping/statping/releases/latest" | grep -o 'tag/[v.0-9]*' | awk -F/ '{print $2}' | head -n1)
wget https://github.com/statping/statping/releases/download/$VERSION/statping-linux-arm-7.tar.gz
tar -xvzf statping-linux-arm-7.tar.gz
chmod +x statping
mv statping /usr/local/bin/statping

statping version
Alpine Linux
The Docker image is using the Statping Alpine binary since it’s so incredibly small. You can run it on your own alpine image by downloading statping-linux-alpine.tar.gz from Latest Releases.
Windows
Installing on Windows
Currently, Statping only works on Windows 64-bit computers. Just download the exe file from Latest Releases and run it in your command prompt. It will create a HTTP server on port 8080, so you can visit http://localhost:8080 to see your Statping Status Page.
Compiling SCSS for Custom Theme
Statping requires sass to be installed to the local machine to compile SCSS into CSS if you want to use the Custom Theme features.
- Node:
npm install sass -g - Ruby:
gem install sass
Running Statping as a Service
To ensure Statping is always running, it can be installed to run as a service on a Windows machine. The easiest way to do that is by using NSSM, the Non-Sucking Service Manager. Download and unzip the compressed file to a location on your machine running Statping to get started: 1. Open an administrative command prompt. 2. Change to the folder that contains the 64 bit version of NSSM. 3. Type “nssm install Statping” and press enter. 4. For the properties, use the following as an example: Path: C:\Program Files\Statping\statping.exe Startup directory: C:\Program Files\Statping 5. Click “Install”. 6. Launch the windows services manager. 7. Run Statping.
Known Issues with Windows
Unfortunately, Statping only works on Windows 64-bit processors. If you have more than 4gb of ram, there’s a good chance you already have a 64-bit processor. Download the Latest Releases of Statping, extract the ZIP file, then double click on the statping.exe file. You can use a SQLite database for a quick setup, or connect to a local/remote Postgres or MySQL database server.
Cloud Foundry
Installation
For OSX, you can install the Cloud Foundry CLI tool from Brew.
brew install cloudfoundry/tap/cf-cli
Statping Yaml Config
You can include multiple environment variables to the configg file. If you include DB_CONN Statping will attempt to automatically connect to that database. View the Full List of Environment Variables to fully customize this config.
applications:
- name: statping
  docker:
    image: statping/statping
  timeout: 180
  env:
    DB_CONN: sqlite / mysql / postgres
    DB_HOST: ...
    DB_PORT: ...
    DB_DATABASE: ...
    DB_USER: ...
    DB_PASS: ...
Save this file as manifest.yml and then run: cf push
Advanced Yaml Config
applications:
- name: statping
  docker:
    image: statping/statping:((version))
  timeout: 180
  env: ((env))
Then you can run a command like:
cf push --var version=v0.80.53 --var env='DB_CONN: sqlite'
Thank you @giner for creating this documentation.
Development
Useful Codebase
handlers/routes.go - Contains all the HTTP request routes
cmd/commands.go - CLI Commands
types/service/struct.go - Service struct
types/core/struct.go - Core struct
Deployment Process
Statping is a pretty cool server for monitoring your services. The way we deploy might be a little cooler though. Statping is using the most bleeding edge technology to release updates and distribute binary files automatically.
- Source code commits get pushed to Github
- go.rice will compile all the static assets into 1 file (rice-box.go in source)
- SASS will generate a compiled version of the CSS.
- Statping Help page is generated by cloning the Wiki repo using
go generate. - Travis-CI tests the Golang application.
- Travis-CI tests the Statping API using Postman.
- If all tests are successful, Travis-CI will compile the binaries using xgo.
- Binaries are code signed using the official PGP key and compressed.
- Docker receives a trigger to build for the
latesttag. - Travis-CI uploads the latest release as a tagged version on Github.
- Travis-CI updates the homebrew-statping repo with the latest version.
And that’s it! Statping is ready to be shipped and installed.
Makefile
Here’s a simple list of Makefile commands you can run using make. The Makefile may change often, so i’ll try to keep this Wiki up-to-date.
Useful Commands
make clean- Cleans the Statping directory for a fresh startmake test-deps- Installs required golang libraries for compiling and building
Building
make build- Build the golang Statping binary for native OSmake compile- Compiles the production frontend Vuemake build-all- Cleans, compiles, and builds all binariesmake build-linux- Builds Linux binariesmake build-mac- Builds MacOSX binariesmake build-win- Builds Windows binaries
Testing
make test- Cleans, compiles and runs golang unit testingmake test-api- Test postman API endpointsmake test-cli- Test that run on Github Actions usingsqlite
Docker
make docker-latest- Builds thebaseandlatestStatping imagesmake start- Run the entire Statping stack with multiple databases and Grafanamake stop- Stop the entire Statping stackmake lite- Run a lite Statping stack that includes Postgres
Required System Libraries
- Ubuntu
apt-get install build-essential - MacOSX
sudo xcode-select -switch /Applications/Xcode.app/Contents/Developer - Windows Install Guide for GNU make utility
- CentOS/RedHat
yum groupinstall "Development Tools"
GraphQL
Statping implements the GraphQL API interface so you can customize the exact data you need within a query. The GraphQL endpoint is at /graphql on your Statping instance and is only available for Authenticated users or while sending the Authorization API Secret.
Example Queries
Retrieve the id, name, and public parameters from service #2.
GraphQL Query:
{
  service(id: 2) {
    id
    name
    public
  }
}
Response:
{
  "data": {
    "service": {
      "id": 2,
      "name": "Statping Github",
      "public": true
    }
  }
}
GraphQL Integration Checklist
[x] Core (read)
[x] Services (read)
[x] Groups (read)
[x] Users (read)
[x] Messages (read)
[x] Failures (read)
[x] Checkins (read)
[ ] Core (update)
[ ] Services (update/create)
[ ] Groups (update/create)
[ ] Users (update/create)
[ ] Messages (update/create)
[ ] Failures (update/create)
[ ] Checkins (update/create)
The code for handling GraphQL requests is in handlers/graphql and is using gqlgen to automatically generate the schema based on the golang structs.
SSL
You can run Statping with a valid certificate by including 2 files in the root directory. Although, I personally recommend using NGINX or Apache to serve the SSL and then have the webserver direct traffic to the Statping instance. This guide will show you how to implement SSL onto your Statping server with multiple options.
LetsEncrypt
You can have Statping generate SSL certificates with LetsEncrypt by entering the following environment variables. Make sure the domain name is pointing to the address of your Statping instance. Once certificates are generated, they will be stored in the certs folder and will automatically renew 30 days before they expire.
LETSENCRYPT_ENABLE- Set to true to have LetsEncrypt enabled. (defaults to false)LETSENCRYPT_HOST- Domain to generate SSL certificateLETSENCRYPT_EMAIL- Email address that gets sent with the LetsEncrypt Request
SSL Certificate with Statping
If you have your own SSL certificates, use this method. To run the Statping HTTP server in SSL mode, you must include 2 files in the root directory of your Statping application. The 2 files you must include are:
- server.crt SSL Certificate File
- server.key SSL Certificate Key File
The filenames and extensions must match the exact naming above. If these 2 files are found, Statping will automatically start the HTTP server in SSL mode using your certificates. You can also generate your own SSL certificates, but you will receive a “ERR_CERT_AUTHORITY_INVALID” error. To generate your own, follow the commands below:
openssl req -new -sha256 -key server.key -out server.csr
openssl x509 -req -sha256 -in server.csr -signkey server.key -out server.crt -days 3650
This will generate a self signed certificate that you can use for your Statup instance. I recommend using a web server to do SSL termination for your server though.
Choose a Web Server or Environment
Choose the environment running the Statping instance. - Docker - NGINX - Apache
Docker
Docker might be the easiest way to get up and running with a SSL certificate. Below is a docker-compose.yml file that will run NGINX, LetEncrypt, and Statping.
Point your domain or subdomain to the IP address of the Docker server. This would be done on CloudFlare, Route53, or some other DNS provider.
Replace the
docker-compose.ymlcontents:
MY.DOMAIN.COMwith the domain you want to useMY@EMAIL.COMwith your email address
- Run the docker container by running command
docker-compose up -d. Give a little bit of time for LetEncrypt to automatically generate your SSL certificate.
docker-compose.yml
version: '2.3'
services:
  nginx:
    container_name: nginx
    image: jwilder/nginx-proxy
    ports:
      - 0.0.0.0:80:80
      - 0.0.0.0:443:443
    labels:
      - "com.github.jrcs.letsencrypt_nginx_proxy_companion.nginx_proxy"
    networks:
      - internet
    restart: always
    volumes:
      - /var/run/docker.sock:/tmp/docker.sock:ro
      - ./statping/nginx/certs:/etc/nginx/certs:ro
      - ./statping/nginx/vhost:/etc/nginx/vhost.d
      - ./statping/nginx/html:/usr/share/nginx/html:ro
      - ./statping/nginx/dhparam:/etc/nginx/dhparam
    environment:
      DEFAULT_HOST: MY.DOMAIN.COM

  letsencrypt:
    container_name: letsencrypt
    image: jrcs/letsencrypt-nginx-proxy-companion
    networks:
      - internet
    restart: always
    volumes:
      - /var/run/docker.sock:/var/run/docker.sock:ro
      - ./statping/nginx/certs:/etc/nginx/certs
      - ./statping/nginx/vhost:/etc/nginx/vhost.d
      - ./statping/nginx/html:/usr/share/nginx/html
      - ./statping/nginx/dhparam:/etc/nginx/dhparam

  statping:
    container_name: statping
    image: statping/statping:latest
    restart: always
    networks:
      - internet
    depends_on:
      - nginx
    volumes:
      - ./statping/app:/app
    environment:
      VIRTUAL_HOST: MY.DOMAIN.COM
      VIRTUAL_PORT: 8080
      LETSENCRYPT_HOST: MY.DOMAIN.COM
      LETSENCRYPT_EMAIL: MY@EMAIL.COM

networks:
  internet:
    driver: bridge
NGINX
If you already have a NGINX web server running, you just have to add a proxy pass and your SSL certs to the nginx config or as a vhost. By default Statping runs on port 8080, you can change this port by starting server with statping --ip 127.0.0.1 --port 9595.
- Replace
/my/absolute/directory/for/cert/server.crtwith SSL certificate file. - Replace
/my/absolute/directory/for/key/server.keywith SSL key file. - Run
service nginx restartand try out https on your domain.
Tutorials
/etc/nginx/nginx.conf
#user  nobody;
worker_processes  1;
events {
    worker_connections  1024;
}
http {
    include            mime.types;
    default_type       application/octet-stream;
    send_timeout       1800;
    sendfile           on;
    keepalive_timeout  6500;
    server {
        listen       80;
        server_name  localhost;
        location / {
          proxy_pass          http://localhost:8080;
          proxy_set_header    Host             $host;
          proxy_set_header    X-Real-IP        $remote_addr;
          proxy_set_header    X-Forwarded-For  $proxy_add_x_forwarded_for;
          proxy_set_header    X-Client-Verify  SUCCESS;
          proxy_set_header    X-Client-DN      $ssl_client_s_dn;
          proxy_set_header    X-SSL-Subject    $ssl_client_s_dn;
          proxy_set_header    X-SSL-Issuer     $ssl_client_i_dn;
          proxy_read_timeout 1800;
          proxy_connect_timeout 1800;
        }
    }
    # HTTPS server

    server {
        listen       443;
        server_name  localhost;

        ssl                  on;
        ssl_certificate      /my/absolute/directory/for/cert/server.crt;
        ssl_certificate_key  /my/absolute/directory/for/key/server.key;
        ssl_session_timeout  5m;

        ssl_protocols  SSLv2 SSLv3 TLSv1;
        ssl_ciphers  ALL:!ADH:!EXPORT56:RC4+RSA:+HIGH:+MEDIUM:+LOW:+SSLv2:+EXP;
        ssl_prefer_server_ciphers   on;

        location / {
          proxy_pass          http://localhost:8080;
          proxy_set_header    Host             $host;
          proxy_set_header    X-Real-IP        $remote_addr;
          proxy_set_header    X-Forwarded-For  $proxy_add_x_forwarded_for;
          proxy_set_header    X-Client-Verify  SUCCESS;
          proxy_set_header    X-Client-DN      $ssl_client_s_dn;
          proxy_set_header    X-SSL-Subject    $ssl_client_s_dn;
          proxy_set_header    X-SSL-Issuer     $ssl_client_i_dn;
          proxy_read_timeout 1800;
          proxy_connect_timeout 1800;
        }
    }
}
Apache
Config with .env File
It may be useful to load your environment using a .env file in the root directory of your Statping server. The .env file will be automatically loaded on startup and will overwrite all values you have in config.yml.
If you have the DB_CONN environment variable set Statping will bypass all values in config.yml and will require you to have the other DB_* variables in place. You can pass in these environment variables without requiring a .env file.
.env File
DB_CONN=postgres
DB_HOST=0.0.0.0
DB_PORT=5432
DB_USER=root
DB_PASS=password123
DB_DATABASE=root

NAME=Demo
DESCRIPTION=This is an awesome page
DOMAIN=https://domain.com
ADMIN_USER=admin
ADMIN_PASSWORD=admin
ADMIN_EMAIL=info@admin.com
USE_CDN=true
POSTGRES_SSLMODE=false # enable ssl_mode for postgres (To enable use require)
DISABLE_LOGS=false # disable logs from appearing and writing to disk

IS_DOCKER=false
IS_AWS=false
SASS=/usr/local/bin/sass
CMD_FILE=/bin/bash
This .env file will include additional variables in the future, subscribe to this repo to keep up-to-date with changes and updates.
config.yml
The config.yml file contains all of the Statping database settings and API keys/secrets. When Statping loads, it will attempt to open this file to parse it’s core values. You can view the Go type file on types/types.go.
config.yml Parameters
- connection: sqlite (sqlite, mysql, postgres)
- host: 0.0.0.0 (database host)
- user: root (database username)
- password: password123 (database password)
- database: root (Statping database name)
- port: 5432 (database port)
- api_key: 1d31a96a8b3… (Public API Key)
- api_secret: 18cd0a7373cb… (Private API Key)
- location: /Users/username/statping_dir (Statping absolute directory)
The location setting will contain core files/folders for Statping like, logs, assets, and should contain the config.yml file.
Using Environment Variables instead of config.yml
You technically don’t need this config.yml file to run Statping. You can also run the Statping server by including environment variables when you start the server. You can view all the available variables by viewing the Config with .env Wiki page.
Statping will auto run with environment variables if DB_CONN is set!
Example config.yml
connection: mysql
host: localhost
user: root
password: password123
database: root
port: 3306
api_secret: apisecretcanbeset
location: /app/statping
Static HTML Exporter
You might have a server that won’t allow you to run command that run longer for 60 seconds, or maybe you just want to export your status page to a static HTML file. Using the Statping exporter you can easily do this with 1 command.
statping export
‘index.html’ is created in current directory with static CDN url’s.
Push to Github
Once you have the index.html file, you could technically send it to an FTP server, Email it, Pastebin it, or even push to your Github repo for Status updates directly from repo.
git add index.html
git commit -m "Updated Status Page"
git push -u origin/master
Prometheus Exporter
Statping includes a prometheus exporter so you can have even more monitoring power with your services. The prometheus exporter can be seen on /metrics, simply create another exporter in your prometheus config. Use your Statping API Secret for the Authorization Bearer header, the /metrics URL is dedicated for Prometheus and requires the correct API Secret has Authorization header.
Grafana Dashboard
Statping has a Grafana Dashboard that you can quickly implement if you’ve added your Statping service to Prometheus. Import Dashboard ID: 6950 into your Grafana dashboard and watch the metrics come in!

Basic Prometheus Exporter
If you have Statping and the Prometheus server in the same Docker network, you can use the yaml config below.
scrape_configs:
  - job_name: 'statping'
    scrape_interval: 30s
    bearer_token: 'SECRET API KEY HERE'
    static_configs:
      - targets: ['statping:8080']
Remote URL Prometheus Exporter
This exporter yaml below has scheme: https, which you can remove if you arn’t using HTTPS.
scrape_configs:
  - job_name: 'statping'
    scheme: https
    scrape_interval: 30s
    bearer_token: 'SECRET API KEY HERE'
    static_configs:
      - targets: ['status.mydomain.com']
/metrics Output
statping_total_failures 206
statping_total_services 4
statping_service_failures{id="1" name="Google"} 0
statping_service_latency{id="1" name="Google"} 12
statping_service_online{id="1" name="Google"} 1
statping_service_status_code{id="1" name="Google"} 200
statping_service_response_length{id="1" name="Google"} 10777
statping_service_failures{id="2" name="Statping.com"} 0
statping_service_latency{id="2" name="Statping.com"} 3
statping_service_online{id="2" name="Statping.com"} 1
statping_service_status_code{id="2" name="Statping.com"} 200
statping_service_response_length{id="2" name="Statping.com"} 2
PGP Signature
You can check if the Statping binary you downloaded is authentic by running a few commands.
Steps to Authenticate
- Download the Statping
tar.gzfile from Latest Releases and extract thestatpingbinary and thestatup.ascfile. - Run command:
gpg --verify statping.asc - You should see
Good signature from "Hunter Long <info@statping.com>" [ultimate].
Statping Public Key
You can also download the key with the command below:
wget https://statping.com/statping.gpg
statping.gpg
-----BEGIN PGP PUBLIC KEY BLOCK-----

mQINBFwGUYIBEADNsDY4aUOx8EoZuTRFPtjuadJzFRyKtHhw/tLlAnoFACanZPIT
NZoRYvRR5v6lMDXdxsteDbJEOhZ1WDiKIr4OyMahPsyyH6ULzSBKgePUswa0sDef
UnXYzPFQCzqQyQQFbp9AYfDP7dW6dTL9I6qU2NqlJvjxJiiZTAq87SmsLqHiASnI
+ottnQuu6vJQBJz2PFIuaS1c3js/+HBbth9GK5B9YN1BIIyZoFmWKVU9HnJf+aM3
Us6OLjjwYwWzQH38ZV84IjVXyiP9PQVhlCXeHK7XdhPZvnSP1m5Wszj/jowwY6Mz
LgLotfL540X7yOJ7hJTFYLFBOtJdJr/3Ov8SH4HXdPFPVG+UqxsmtmPqUQ9iAxAE
jRFfkAxBvH5Szf2WZdaLnlrrOcOKJIIjZgHqalquBTAhlh5ul0lUVSSPxetwIBlW
60L41k94NJFGDt8xOJ+122mLcywmQ1CzhDfeIKlxl6JDiVHjoRqlQQrqIoNZMV85
rzGfrmbuwv1MXGBJoiNy3330ujOBmhQ9dQVwKpxhBKdjnAgIGM9szbUYxIkGgM1O
U4b1WF3AF/9JOpKJ0LewslpM3BFFYnemGsHXAv3TBPqKidNdwMAiBOtNykGoXF6i
0D6jOW/IB1da0gUA+kr5JdAOwIG7JXKhur2MO7Ncid59DL2N8RePRWj+jwARAQAB
tB9IdW50ZXIgTG9uZyA8aW5mb0BzdGF0cGluZy5jb20+iQJOBBMBCAA4FiEEt21h
+qbbdZRm6D2ZZLnGquLVUngFAlwGUYICGwMFCwkIBwIGFQoJCAsCBBYCAwECHgEC
F4AACgkQZLnGquLVUnizwA//c7vmwTMq/8LYlbo37WM2kDE9AKIrz6VSMq4RhGbC
LikH0X0epa+if79n9BZrVU/Af3aKTn7vu2J4XrvzcdCXtcsR0YmCWML2Y6OSFmhX
w3o6woiFcp+SUWdcM/kithRun+j9sKV4akdgkdBQUdh/RMVln+radz1c6G59iTdh
S+Ip3ObO7Gn5VnrLwxix+W9Jhg8YhDgDGEDt8e1yvjuMRY+WhjHFlwEMoE0kvQL8
QvQH2dGD3dExWAuIL7+0xC0ZGU0PR8vRrq1ukdIsWlDY+42vvhcyPZKFFDTM/QLF
FcCNiPSGhiK/NQq67xnRMFdh0fnqbydWj2atMpacIrheEkOt8db2/UMyDOwlIxgy
KOG8x+yNKiG9LyvW4axRLctN608/+TbvtFo5TVOFJYxJQp4b5uz7LgJAJw7PBvfC
bqx64BH8WGzgyGcAl9unQEtpDuxXoKvP2kbsS7hjvhK0gJgW9llpV4sRJJGApTBc
WtbcS9DBGs3k1aZdA72bxnayD32syVz7czl4+tkRsbQZ4VgJh1yrHIDsdWQXFnYu
EQJfCgX5HvvC13MpDUth0NWCFtWQirY3EFbIgSuhB/D5iXA+Dt1Dq5c1u7wQlUVi
LQCU++oMGrlU3gZrnov5lnBGCEjn0O9bKQm8zmLdEcENFxUZvfPjOIY64YprZxD9
Bv65Ag0EXAZRggEQAMmjHmnvH8SvNJhku/oI96dFKen3bg9xdaFUD1vAuNglCalH
wgXcCZd0RdobYNG46cXTzTQadtHS4hi/UBJ+oy5ZUpIRglW12eTYtqM2G11VbcQi
j6rLITP9NIP+G1xBICSYK4UwmH55BolMEQ/1ZX0a9rESM9stDNglheCCudbMGR/1
ZYnufdEsh0yPwyC/1upZeu8LPWK62pt9mE/gccx77QTeDi5OJcRf1fPbUTCm3vSS
wPPV2AGANodIhostjDymt5vh0tGwc7oUZZLnVdErfuctv7yMgZdiCpYu0jFy1NYf
JgOpZasrcK7/1ozGzsfAo/sSU4kIkMwuWGgqfx5kGRK2CgU4T0i7oI6DMpOX9ZS8
s3+oCWu83X0ofvm5R2CbjiUj2gR6JOhBQbJpCeTkLe+SFcUpnyrr7lG8B8QZHm5N
nBi05V/s63RE3g/6WpR/fWuh+uswe01uqlSx9deW7jT49BL/MdSxwjfwLBLz/hLM
0ld385XAd9bqMjUtp0XhZX2YORx3f/aKY7PYA62baGibb5RdPRw6viEAWU20eb+8
X9Pa7hGmwUeal5lka4SD/TGl7wdY+g4oYP+jtKinH/ZftWA5wHTe3jWT5bdWrT2d
e+0qA0SBkmKIDLpktvtTa19w2nfwBIwJ6fN36ZjYpOn/stxR7aRtnhSqvzxbABEB
AAGJAjYEGAEIACAWIQS3bWH6ptt1lGboPZlkucaq4tVSeAUCXAZRggIbDAAKCRBk
ucaq4tVSeGWmD/9Pg1x6s98zdZCQa2apmUnuoQAQA9Gf2RBBuglCDGsY67wbvdHZ
9wdFRs2QEhl2O3oFmidxthBOBRl9z62nXliLwNn1Lcy/yDfaB8wH6gMm4jn2N/z9
vQXnyIzg8m4PItZ1p5mnY3qH5lpGF8r9Gb7tzK10rqulM2XTDojZOevlEGI6LGw8
FjccXtNquqGZwxzytmKF3T7UBmpmt2qock8N5iJn987m6WeYmbFNc0ii0guHfdtO
zQcItz2ngCdyvfgQPwCAoAv72ysSGhz5KZgAXRrEdcqj6Jw3ivoEUKq1aUrYncXQ
3zC3ED6AjWOGRzjvTZzj22IVacUZ0gqx0x/oldXLOhMB9u6nFXHKj1n9nc0XHMNi
Lp9EuvQgcNLjFZGE9sxh25u9V+OhItfT/aarYEu/Xq0IkUUcdz4GehXth1/Cq1wH
lSUie4nCs7I7OWhqMNClqP7ywElDXsQ66MCgvf01Dh64YUVjJNnyyK0QiYlCx/JQ
Z85hNLtVXZfYqC5BRZlVFp8I8Rs2Qos9YEgn2M22+Rj+RIeD74LZFB7Q4myRvTMB
/P466dFI83KYhwvjBYOP3jPTrV7Ky8poEGifQp2mM294CFIPS7z0z7a8+yMzcsRP
OluFxewsEO0QNDrfFb+0gnjYlnGqOFcZjUMXbDdY5oLSPtXohynuTK1qyQ==
=Xn0G
-----END PGP PUBLIC KEY BLOCK-----
Statping.com | Demo | Docker | Notifiers | API