|
|
||
|---|---|---|
| .. | ||
| Makefile | ||
| README.md | ||
| synth-logger.png | ||
| synthetic_0_25lps.yaml | ||
| synthetic_10lps.yaml | ||
README.md
Elasticsearch/Kibana Logging Demonstration
This directory contains two pod specifications which can be used as synthetic loggig sources. The pod specification in synthetic_0_25lps.yaml describes a pod that just emits a log message once every 4 seconds:
# This pod specification creates an instance of a synthetic logger. The logger
# is simply a program that writes out the hostname of the pod, a count which increments
# by one on each iteration (to help notice missing log enteries) and the date using
# a long format (RFC-3339) to nano-second precision. This program logs at a frequency
# of 0.25 lines per second. The shellscript program is given directly to bash as -c argument
# and could have been written out as:
#   i="0"
#   while true
#   do
#     echo -n "`hostname`: $i: "
#     date --rfc-3339 ns
#     sleep 4
#     i=$[$i+1]
#   done

apiVersion: v1beta1
kind: Pod
id: synthetic-logger-0.25lps-pod
desiredState:
  manifest:
    version: v1beta1
    id: synth-logger-0.25lps
    containers:
      - name: synth-lgr
        image: ubuntu:14.04
        command: ["bash", "-c", "i=\"0\"; while true; do echo -n \"`hostname`: $i: \"; date --rfc-3339 ns; sleep 4; i=$[$i+1]; done"]
labels:
  name: synth-logging-source
The other YAML file synthetic_10lps.yaml specifies a similar synthetic logger that emits 10 log messages every second. To run both synthetic loggers:
$ make up
../../../kubectl.sh create -f synthetic_0_25lps.yaml
Running: ../../../cluster/../cluster/gce/../../_output/dockerized/bin/linux/amd64/kubectl create -f synthetic_0_25lps.yaml
synthetic-logger-0.25lps-pod
../../../kubectl.sh create -f synthetic_10lps.yaml
Running: ../../../cluster/../cluster/gce/../../_output/dockerized/bin/linux/amd64/kubectl create -f synthetic_10lps.yaml
synthetic-logger-10lps-pod
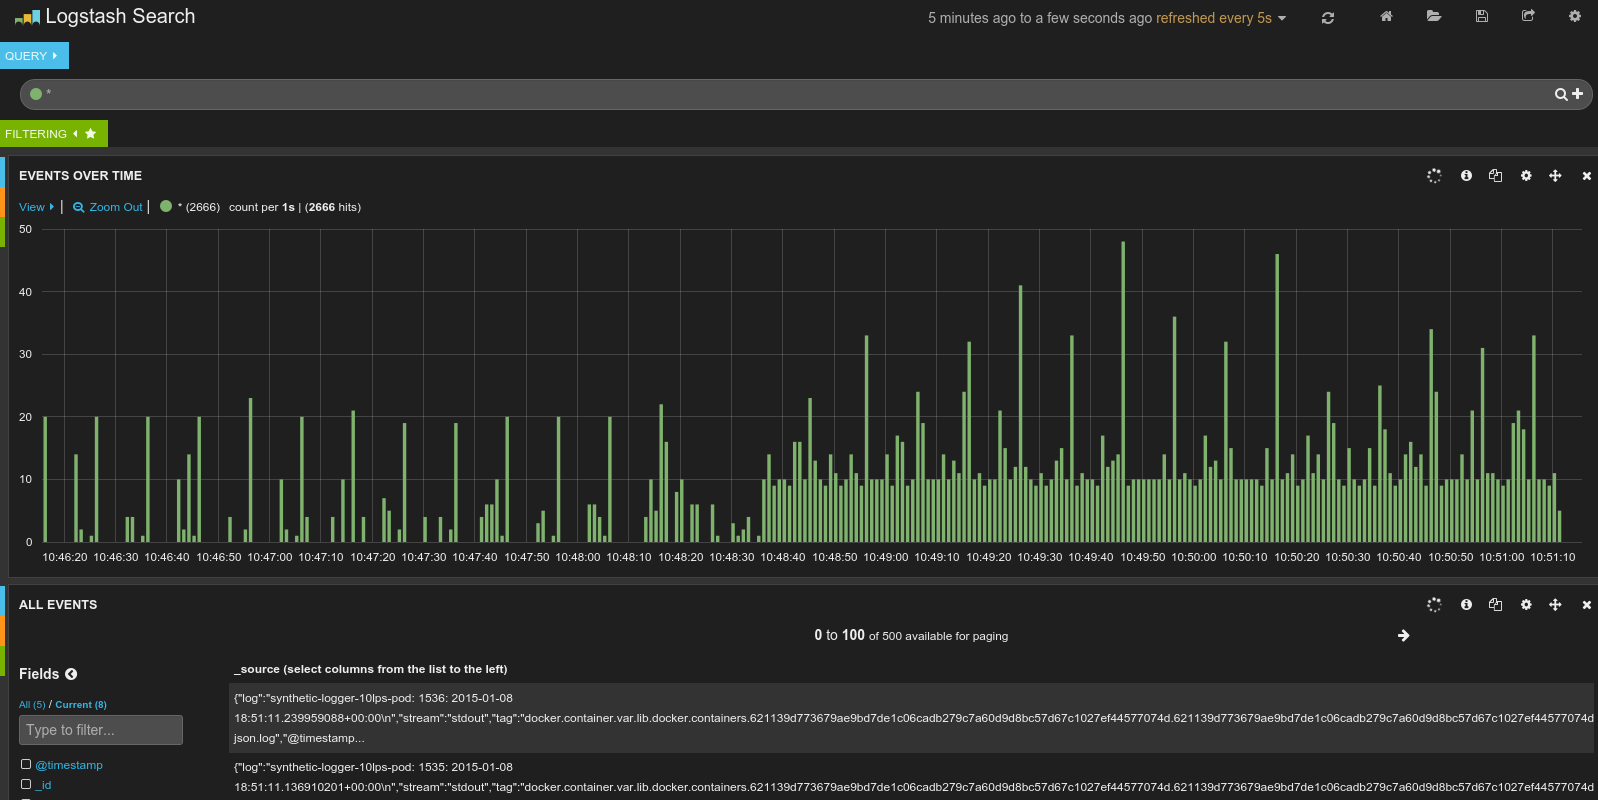
Visiting the Kibana dashboard should make it clear that logs are being collected from the two synthetic loggers:
You can report the running pods, replication controllers and services with another Makefile rule:
$ make get
../../../kubectl.sh get pods
Running: ../../../../cluster/gce/../../_output/dockerized/bin/linux/amd64/kubectl get pods
POD                                    CONTAINER(S)            IMAGE(S)                           HOST                                                            LABELS                       STATUS
7e1c7ce6-9764-11e4-898c-42010af03582   kibana-logging          kubernetes/kibana                  kubernetes-minion-3.c.kubernetes-elk.internal/130.211.129.169   name=kibana-logging          Running
synthetic-logger-0.25lps-pod           synth-lgr               ubuntu:14.04                       kubernetes-minion-2.c.kubernetes-elk.internal/146.148.41.87     name=synth-logging-source    Running
synthetic-logger-10lps-pod             synth-lgr               ubuntu:14.04                       kubernetes-minion-1.c.kubernetes-elk.internal/146.148.42.44     name=synth-logging-source    Running
influx-grafana                         influxdb                kubernetes/heapster_influxdb       kubernetes-minion-3.c.kubernetes-elk.internal/130.211.129.169   name=influxdb                Running
                                       grafana                 kubernetes/heapster_grafana
                                       elasticsearch           elasticsearch
heapster                               heapster                kubernetes/heapster                kubernetes-minion-2.c.kubernetes-elk.internal/146.148.41.87     name=heapster                Running
67cfcb1f-9764-11e4-898c-42010af03582   etcd                    quay.io/coreos/etcd:latest         kubernetes-minion-3.c.kubernetes-elk.internal/130.211.129.169   k8s-app=skydns               Running
                                       kube2sky                kubernetes/kube2sky:1.0
                                       skydns                  kubernetes/skydns:2014-12-23-001
6ba20338-9764-11e4-898c-42010af03582   elasticsearch-logging   elasticsearch                      kubernetes-minion-3.c.kubernetes-elk.internal/130.211.129.169   name=elasticsearch-logging   Running
../../../cluster/kubectl.sh get replicationControllers
Running: ../../../cluster/../cluster/gce/../../_output/dockerized/bin/linux/amd64/kubectl get replicationControllers
CONTROLLER                         CONTAINER(S)            IMAGE(S)                           SELECTOR                     REPLICAS
skydns                             etcd                    quay.io/coreos/etcd:latest         k8s-app=skydns               1
                                   kube2sky                kubernetes/kube2sky:1.0
                                   skydns                  kubernetes/skydns:2014-12-23-001
elasticsearch-logging-controller   elasticsearch-logging   elasticsearch                      name=elasticsearch-logging   1
kibana-logging-controller          kibana-logging          kubernetes/kibana                  name=kibana-logging          1
../../.../kubectl.sh get services
Running: ../../../cluster/../cluster/gce/../../_output/dockerized/bin/linux/amd64/kubectl get services
NAME                    LABELS                                    SELECTOR                     IP                  PORT
kubernetes-ro           component=apiserver,provider=kubernetes   <none>                       10.0.83.3           80
kubernetes              component=apiserver,provider=kubernetes   <none>                       10.0.79.4           443
influx-master           <none>                                    name=influxdb                10.0.232.223        8085
skydns                  k8s-app=skydns                            k8s-app=skydns               10.0.0.10           53
elasticsearch-logging   <none>                                    name=elasticsearch-logging   10.0.25.103         9200
kibana-logging          <none>                                    name=kibana-logging          10.0.208.114        5601
The net rule in the Makefile will report information about the Elasticsearch and Kibana services including the public IP addresses of each service.
$ make net
../../../kubectl.sh get services elasticsearch-logging -o json
current-context: "kubernetes-satnam_kubernetes"
Running: ../../../../cluster/gce/../../_output/dockerized/bin/linux/amd64/kubectl get services elasticsearch-logging -o json
{
    "kind": "Service",
    "id": "elasticsearch-logging",
    "uid": "e5bf0a51-b87f-11e4-bd62-42010af01267",
    "creationTimestamp": "2015-02-19T21:40:18Z",
    "selfLink": "/api/v1beta1/services/elasticsearch-logging?namespace=default",
    "resourceVersion": 68,
    "apiVersion": "v1beta1",
    "namespace": "default",
    "port": 9200,
    "protocol": "TCP",
    "labels": {
        "name": "elasticsearch-logging"
    },
    "selector": {
        "name": "elasticsearch-logging"
    },
    "createExternalLoadBalancer": true,
    "publicIPs": [
        "104.154.81.135"
    ],
    "containerPort": 9200,
    "portalIP": "10.0.58.62",
    "sessionAffinity": "None"
}
../../../kubectl.sh get services kibana-logging -o json
current-context: "kubernetes-satnam_kubernetes"
Running: ../../../../cluster/gce/../../_output/dockerized/bin/linux/amd64/kubectl get services kibana-logging -o json
{
    "kind": "Service",
    "id": "kibana-logging",
    "uid": "e5bd4617-b87f-11e4-bd62-42010af01267",
    "creationTimestamp": "2015-02-19T21:40:18Z",
    "selfLink": "/api/v1beta1/services/kibana-logging?namespace=default",
    "resourceVersion": 67,
    "apiVersion": "v1beta1",
    "namespace": "default",
    "port": 5601,
    "protocol": "TCP",
    "labels": {
        "name": "kibana-logging"
    },
    "selector": {
        "name": "kibana-logging"
    },
    "createExternalLoadBalancer": true,
    "publicIPs": [
        "104.154.91.224"
    ],
    "containerPort": 80,
    "portalIP": "10.0.124.153",
    "sessionAffinity": "None"
}
For this example the Elasticsearch service is running at http://104.154.81.135:9200.
$ curl http://104.154.81.135:9200
{
  "status" : 200,
  "name" : "Wombat",
  "cluster_name" : "elasticsearch",
  "version" : {
    "number" : "1.4.4",
    "build_hash" : "c88f77ffc81301dfa9dfd81ca2232f09588bd512",
    "build_timestamp" : "2015-02-19T13:05:36Z",
    "build_snapshot" : false,
    "lucene_version" : "4.10.3"
  },
  "tagline" : "You Know, for Search"
}
Visiting the URL http://104.154.91.224:5601 should show the Kibana viewer for the logging information stored in the Elasticsearch service running at http://104.154.81.135:9200.